Designed for the art. Engineered for the archive.
A museum’s history, rebuilt as infrastructure.
In its twentieth year, the Museum of Contemporary Art Detroit decided its website should carry the institution it had become. Two decades of exhibitions, events and writing had accumulated on a platform built for a much smaller museum. Exhibitions were filed as blog posts, events ran on a plugin, the store sat on another domain: each a sensible answer at the time it was made. Working alongside the museum’s team, we rebuilt the site on a real content model, reconstructed two decades of exhibition history, turned years of essays and recordings into a content library that had never existed, and launched in April 2026, as the museum entered its twentieth year. In the first full quarter after launch, organic clicks were up {{ cpdChangeWord }} a day.
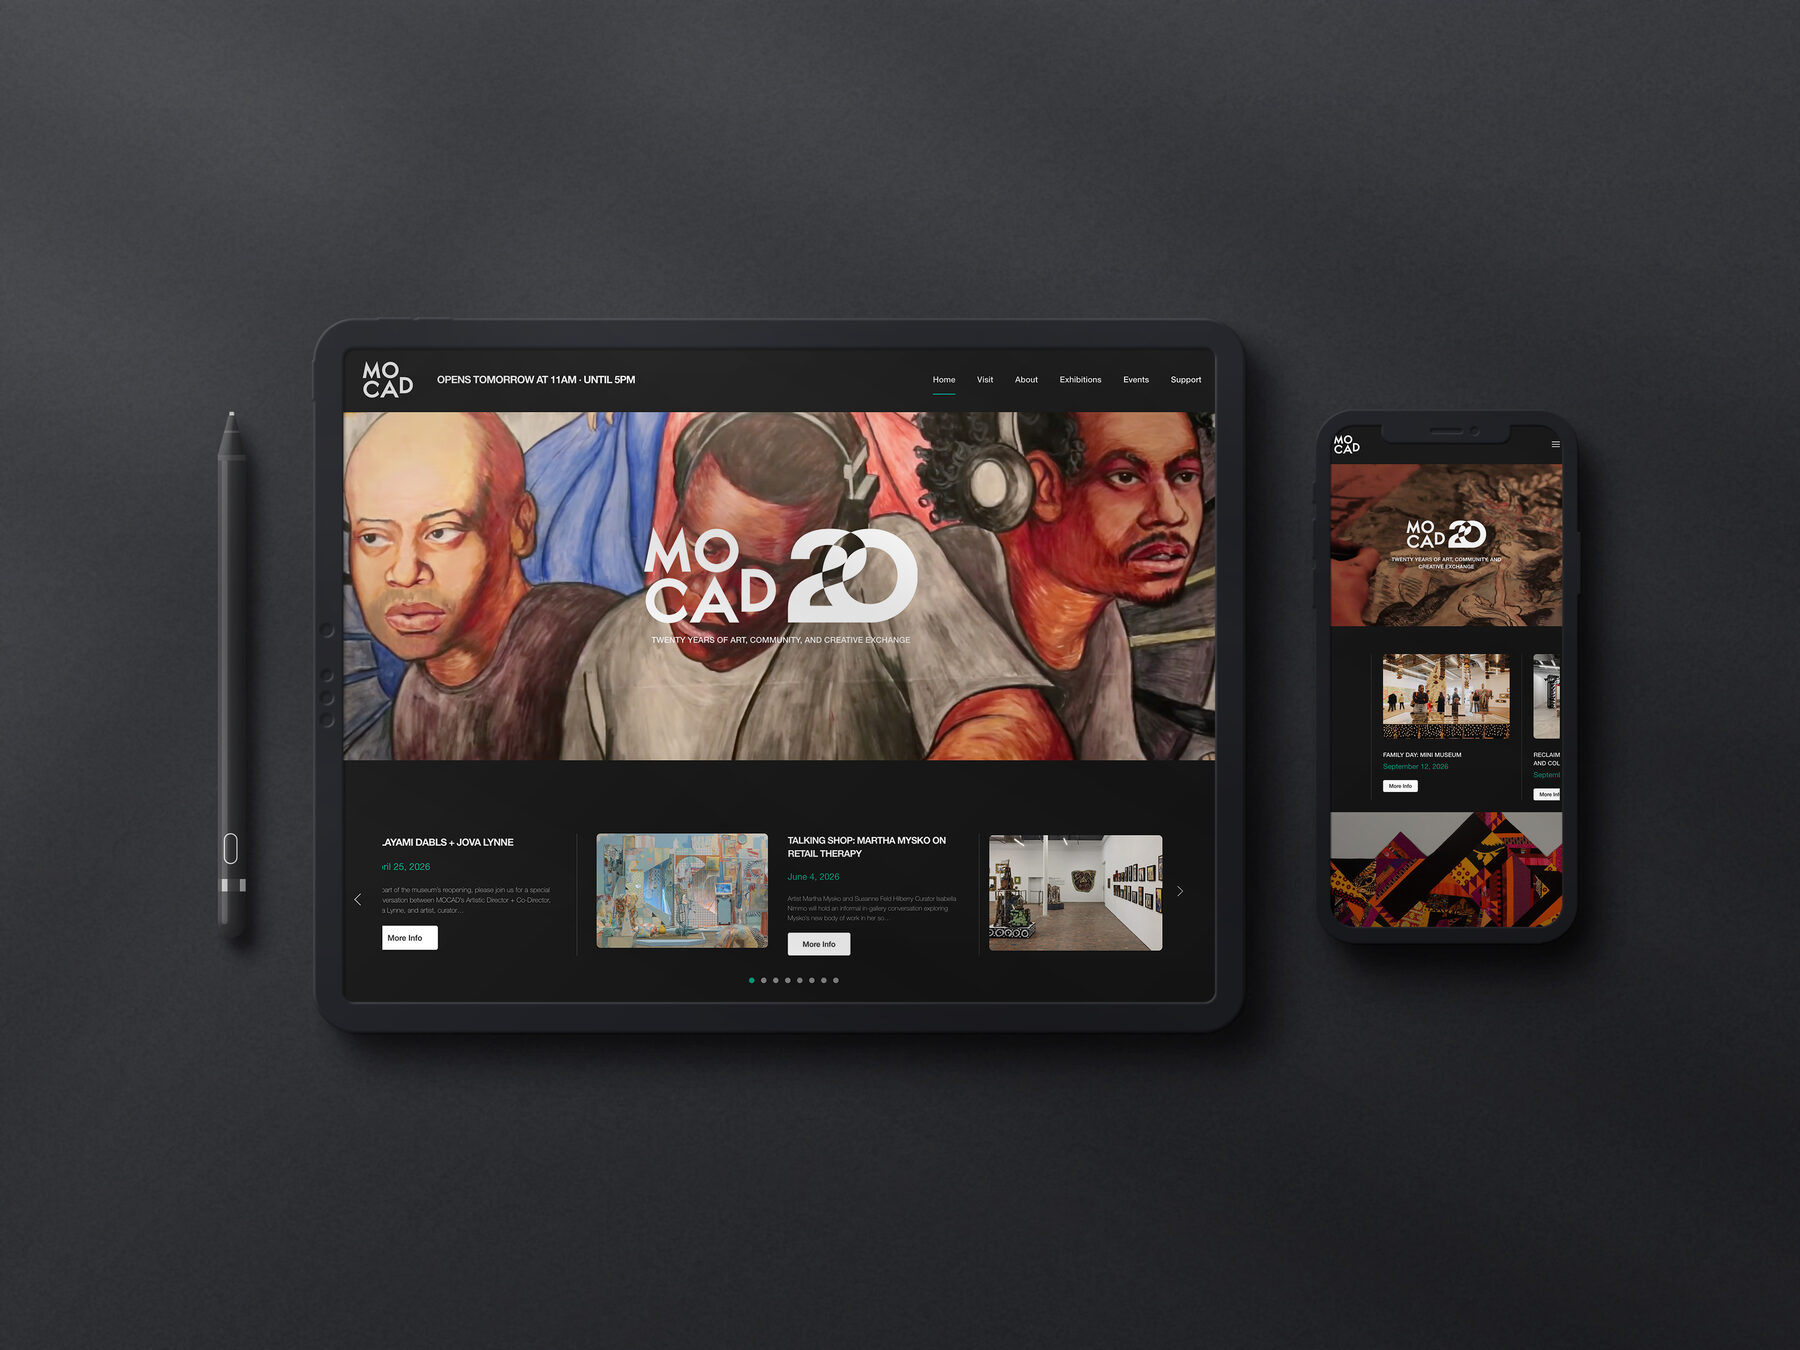
A redesign on the surface, and underneath it a rebuild. Twenty years of exhibitions, events and writing to carry across, an address space to organize, five systems to bring together behind one front door, and a launch date fixed months in advance.
In their words
MOCADMuseum of Contemporary Art Detroit
“Working with Bnevol on MOCAD's website redesign was an exceptional experience from start to finish. Zehn brought an incredible level of care, thoughtfulness, and attention to detail to every aspect of the project and was endlessly patient with my very particular, detailed feedback and requests. He was consistently responsive, collaborative, and genuinely invested in getting everything right.
Beyond executing the redesign beautifully, he helped us strategically refine and implement our ideas so they could come to life in ways that truly made sense for our organization, goals, and audiences. What really stood out was his ability to translate our ideas into thoughtful, functional solutions rather than simply implementing requests at face value.
He even went above and beyond the original project scope by building us a custom Read + Watch + Listen library because he believed it would strengthen the overall site experience. The final site feels deeply aligned with MOCAD's mission, is more modern and easy to use, and we could not be happier with the outcome. As we are celebrating our 20th anniversary this year, it has helped bring our institution into a new era. I would highly recommend him to anyone looking for a talented, thoughtful, and reliable web developer.”
A hub for emerging ideas in the contemporary arts

The Museum of Contemporary Art Detroit presents exhibitions and programs that connect Detroit to the global art world, from a 22,000 square foot former auto dealership on Woodward Avenue, along with Mike Kelley's Mobile Homestead, the artist's full scale replica of his childhood home, which sits on the museum's grounds and works as a public art work and a community venue at the same time.
In 2026 MOCAD entered its twentieth year. The building was coming out of a physical renovation, the museum was preparing a new spring season, and the institution was in what its own team described as a transitional period, with staffing changes underway and a new cycle beginning.
The website underneath all of it had been built for a smaller, younger version of the institution, and it was still carrying everything the museum had done since.
The museum’s team knew it. Rather than patch it through another season, they made the call to rebuild properly and went looking for a partner to do it with. Everything in this case study follows from that decision, which was theirs before it was ours.
The museum had already made the hard call
By the time we were brought in, MOCAD had done the difficult part. They had looked honestly at a site that had served them for two decades, concluded it could no longer carry the institution they had become, and decided to rebuild rather than work around it for another year. That decision is a hard one to reach, and they reached it early, and on their own.
Nothing that follows was anyone’s mistake. Each piece was a sensible answer at the time it was made, and what we were both looking at is what twenty years of sensible answers add up to when the structure underneath them was never designed to hold that much. Some of this the museum handed us on day one. The rest we uncovered together, and the depth of it surprised us both.
The software had made routine work risky
The legacy site broke often enough that routine updates carried real risk. The team responded the way any careful team responds to a fragile system: they touched it as little as possible and protected it by working around it, which is the reason a twenty year old platform kept serving the public as long as it did. The museum’s Web Manager, who looks after the site alongside a full workload, described the job as holding a bag and trying to keep it from ripping.
That cost never shows up as downtime, which is why it is easy to miss. It is the work that quietly stops being possible because the tool makes it expensive.
The content model had not kept pace with the institution
Exhibitions were blog posts. Events ran on a calendar plugin whose styling could not be brought on brand. Job postings and press releases shared a generic resources feature. The homepage grid was ordered by manually editing publish dates so a query would return the right sequence. Every one of those is a workaround the team invented so the site would do something it had never been built to do, and every one of them worked. What none of them could do was scale, because each was standing in for the same missing thing: content types shaped like the museum’s own world.
Twenty years of history, resting on software that had to hold
A museum's past exhibitions are the record of what it has done, and keeping them available depends entirely on the software holding up for twenty years. Here the software had not held. Failures in the events plugin took the past events archive with them, and most of what it held could not be recovered. Past exhibitions survived only because the museum’s Web Manager was maintaining a grid of them by hand, which is the reason two decades of shows are still on the site today.
Twenty years of addresses, with no namespace to organize them
Every exhibition lived at the root of the domain: /code-switch/, /brood/, /girlhood/, /well-wishes/. Nothing distinguished an exhibition from a landing page from a retired campaign. One show made the consequence vivid: Dual Vision, which paired artists and gave each pairing its own page, existed as twenty separate top level addresses, /dv-01/ through /dv-20/, none of which said anything about what they contained. The platform was also publishing pages nobody had asked it for: uncategorized category archives, paginated tag pages, and month by month event archives, all crawled and indexed.
The visitor kept getting handed off
The store was an external link. Tickets went to a third party site. Donations, membership and the newsletter each sat in their own system. Each tool was doing its job well. The gap was between them: every handoff is a moment where a visitor leaves the institution's website and lands somewhere that looks nothing like it, and a moment where the institution loses both the experience and the data.
Split hosting, and a launch date that could not move
The domain was registered at Network Solutions. The managed site was at GoDaddy. That split is a common inheritance, and it was a standing source of friction, with a staging environment whose sync lag made the review workflow, the one thing the team most wanted to protect, unreliable. And the launch date was set months in advance, against a spring season and a twentieth anniversary year planned around it. It was not a date that could slip while the website caught up.
A website is a marketing asset, not an operational one.
The obvious move on a project like this is to pull everything native. Build ticketing and RSVP into the site, own the checkout, own the check in, put every function behind one login. It is a common approach. We talked it through with the museum and agreed not to, for reasons that have far more to do with how an institution runs than with how a website looks.
The moment ticketing, payments and attendee data live inside the website, the website becomes the system of record for functions that have nothing to do with publishing. And a website should not be the single point at which finance, sales and operations fail together. Keeping ticketing on a dedicated platform means a bad afternoon on the website is a bad afternoon on the website. Nothing about it touches the ability to sell a ticket, admit a visitor or close the books.
Integrate at the presentation layer. Decouple at the operational layer.
The best idea on this project was not ours
The museum's real problem was never a shortage of material. Twenty years of essays, films, artist talks and printed gallery handouts existed only as attachments to exhibition pages and as PDFs: invisible, unsearchable, unpromotable. Structuring them as first class content was more work than a like for like rebuild, and it is the part of this project we expect to matter longest.
The idea came from the museum’s Web Manager, who pointed to peer institutions with a dedicated read, watch and listen section and wanted one. It sat outside the signed scope. We agreed it was the highest value thing available on the project, so rather than log it for a future phase we brought it into this one. Read + Watch + Listen was built beyond the original scope, for the straightforward reason that the client was right about it and it made the rest of the site worth more.
Seven phases, in the order that removes the most risk first
Server and hosting configuration, DNS ownership across two providers, plugin inventory, content audit across every page type, systems audit across the store, ticketing, email, donations and membership, and twelve months of Google Search Console performance, so that every subsequent decision could be weighted by what people actually visit rather than by what we expected to matter. Two findings changed the plan.
Distinct content types for exhibitions, events, editorial content, artists and board members, each with its own field structure. Taxonomies for event category, building and gallery, so the difference between a program in the Woodward gallery and one at the Mobile Homestead is data rather than something that has to be retyped on every record. Two decisions do most of the work: bidirectional relationships, entered once and appearing everywhere they belong, and an edge case field group, so the unusual show is a supported case rather than a developer ticket. That second decision is what a rebuild leans on hardest once the content starts changing again.
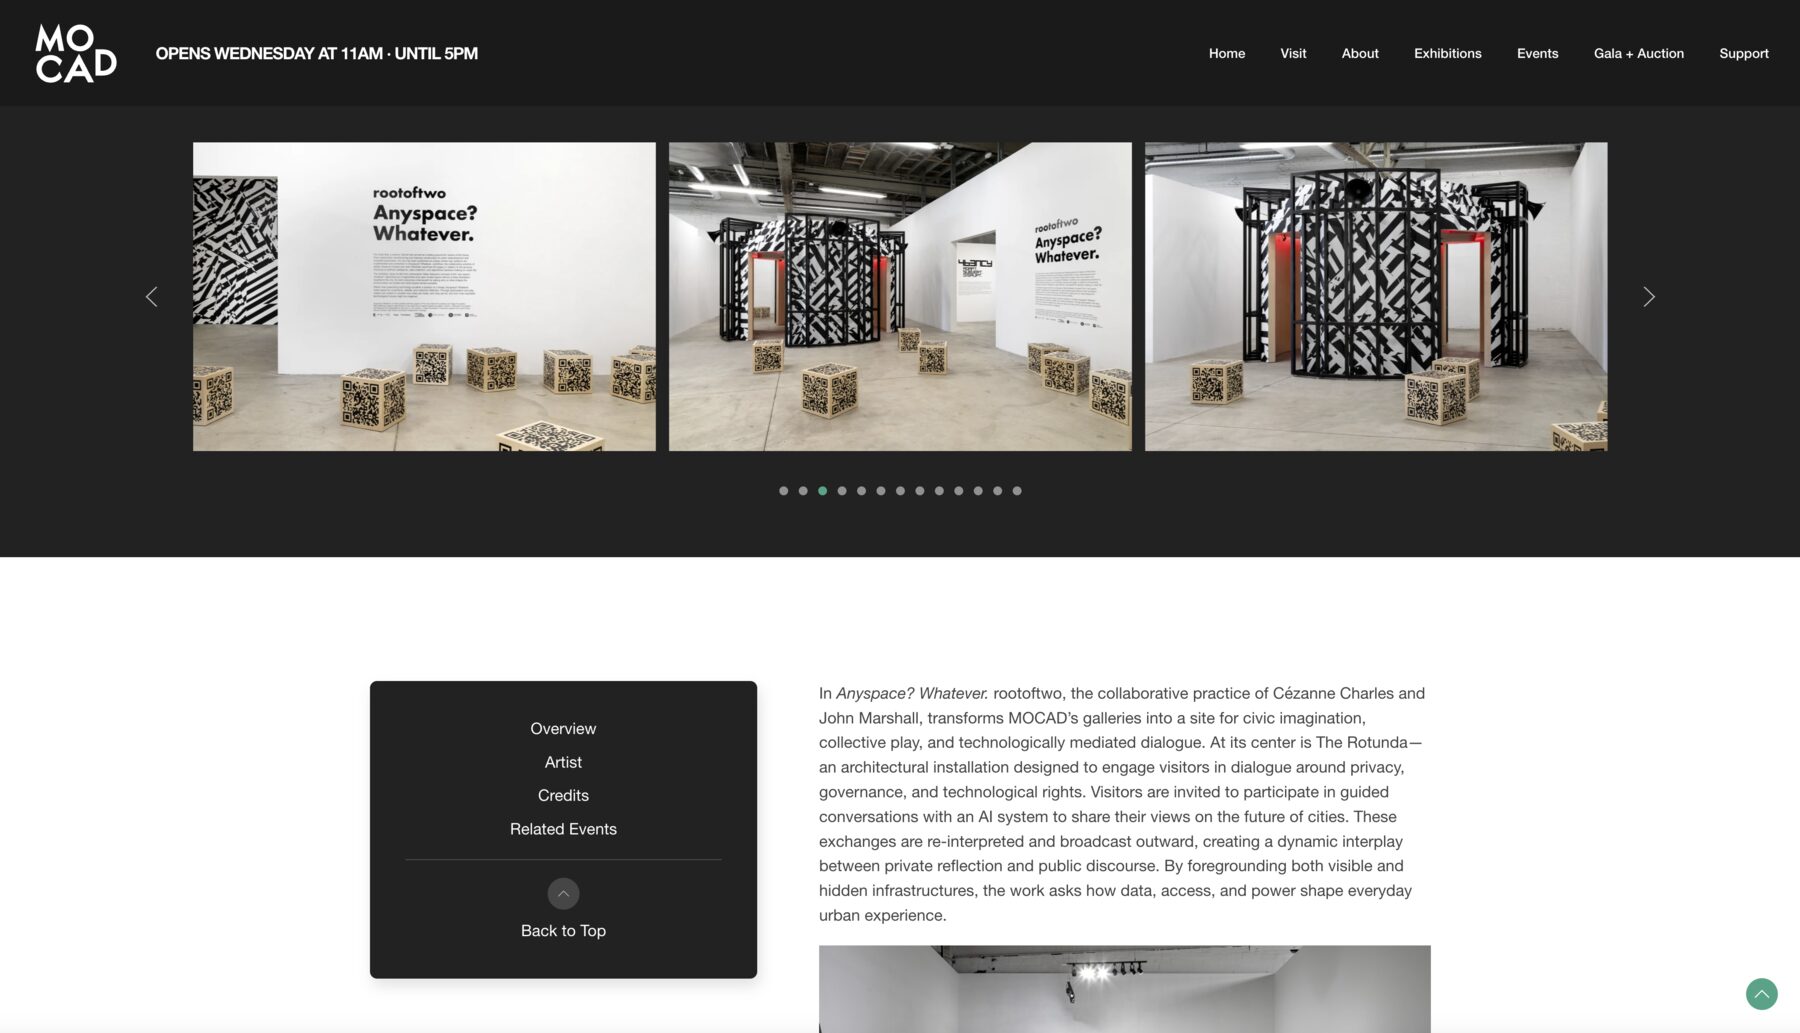
The design had to hold contemporary art without competing with it. Generous imagery, inline contextual photography placed with the prose it belongs to, and a clear separation between curatorial text and an artist's biography. Two client rules shaped the system more than any aesthetic choice: no text baked into images, because it cannot be edited, translated or read by a screen reader. And typography that respects how artists write their own names. Several artists in the archive set their names in lowercase, and a museum that publishes one of them with an automatic capital letter is getting a fact wrong, not making a style choice.
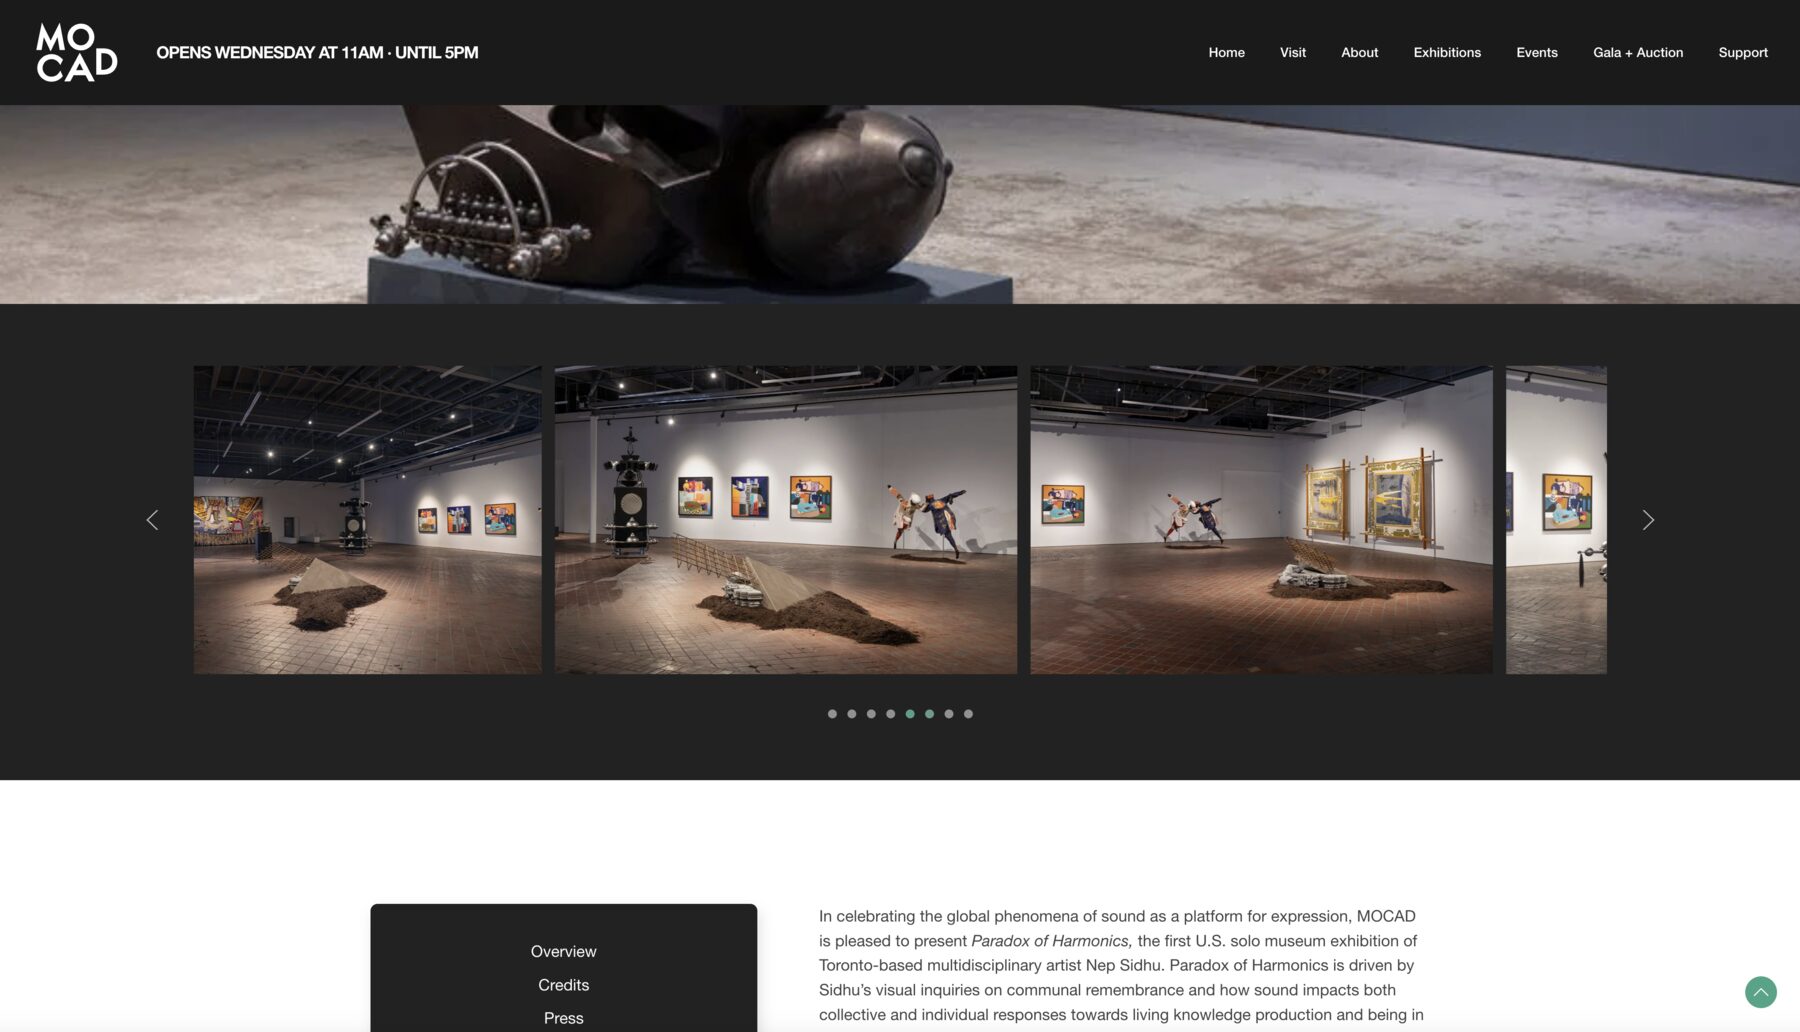
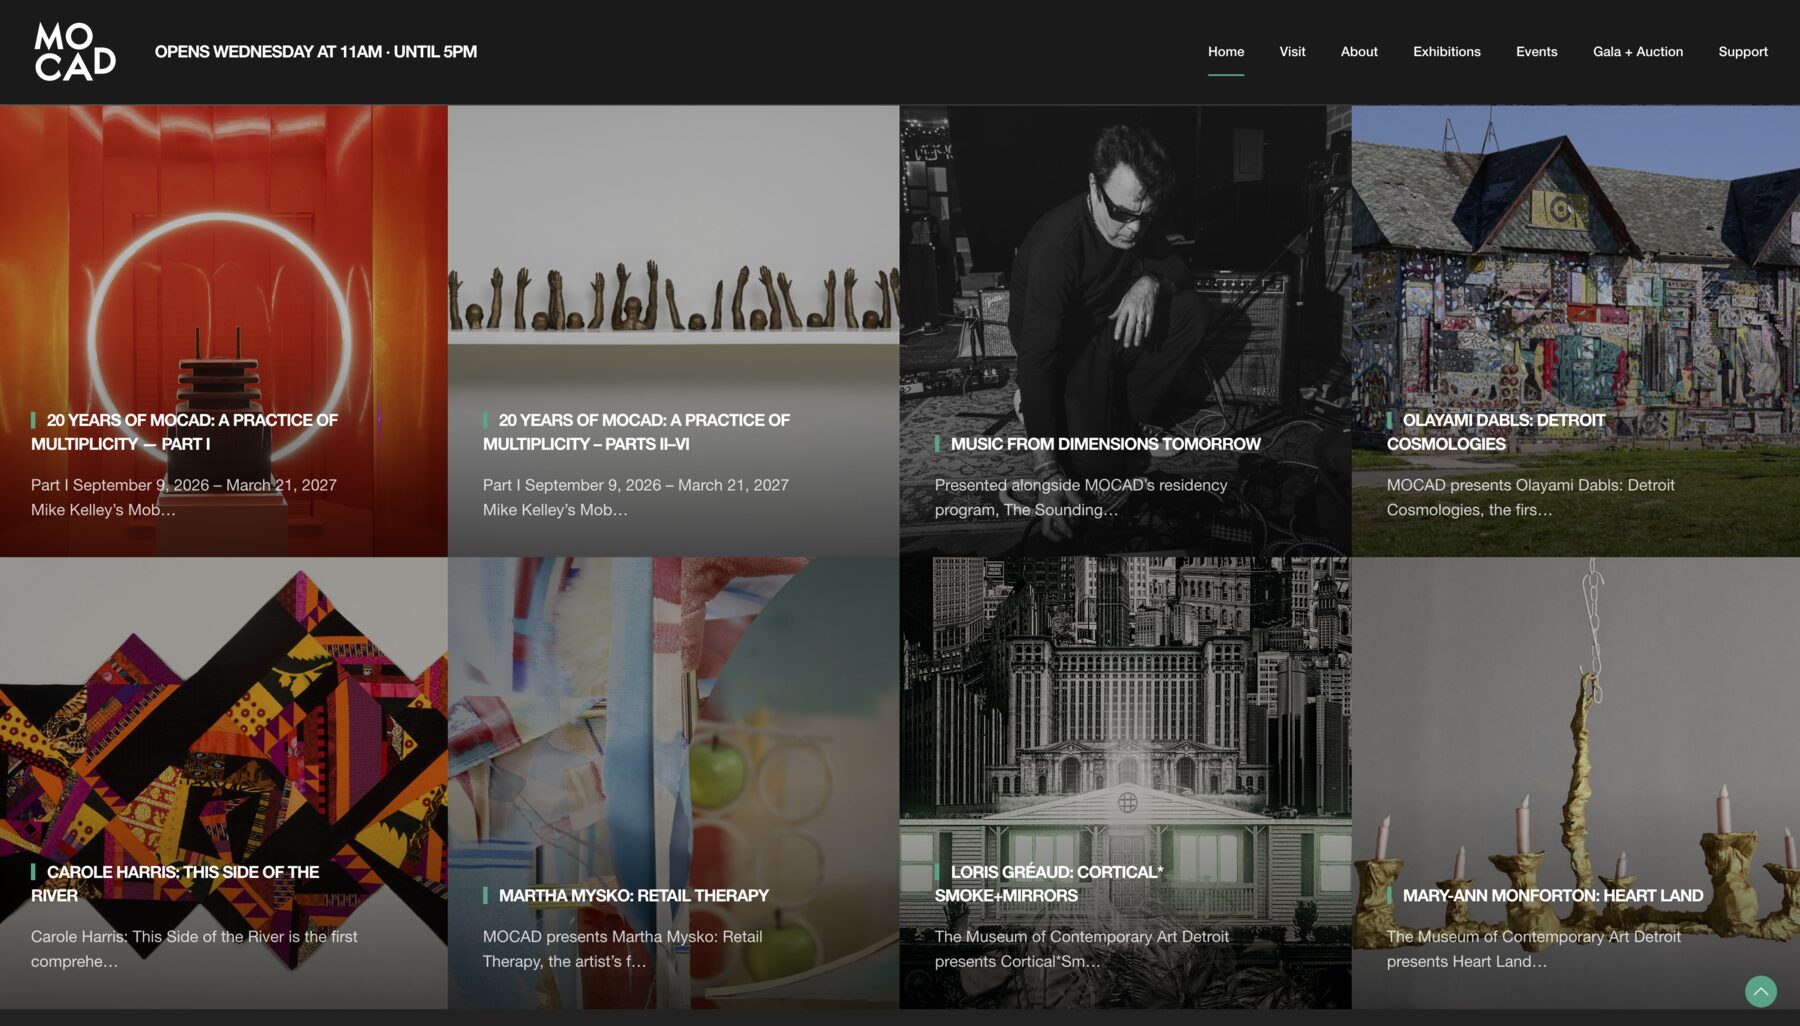
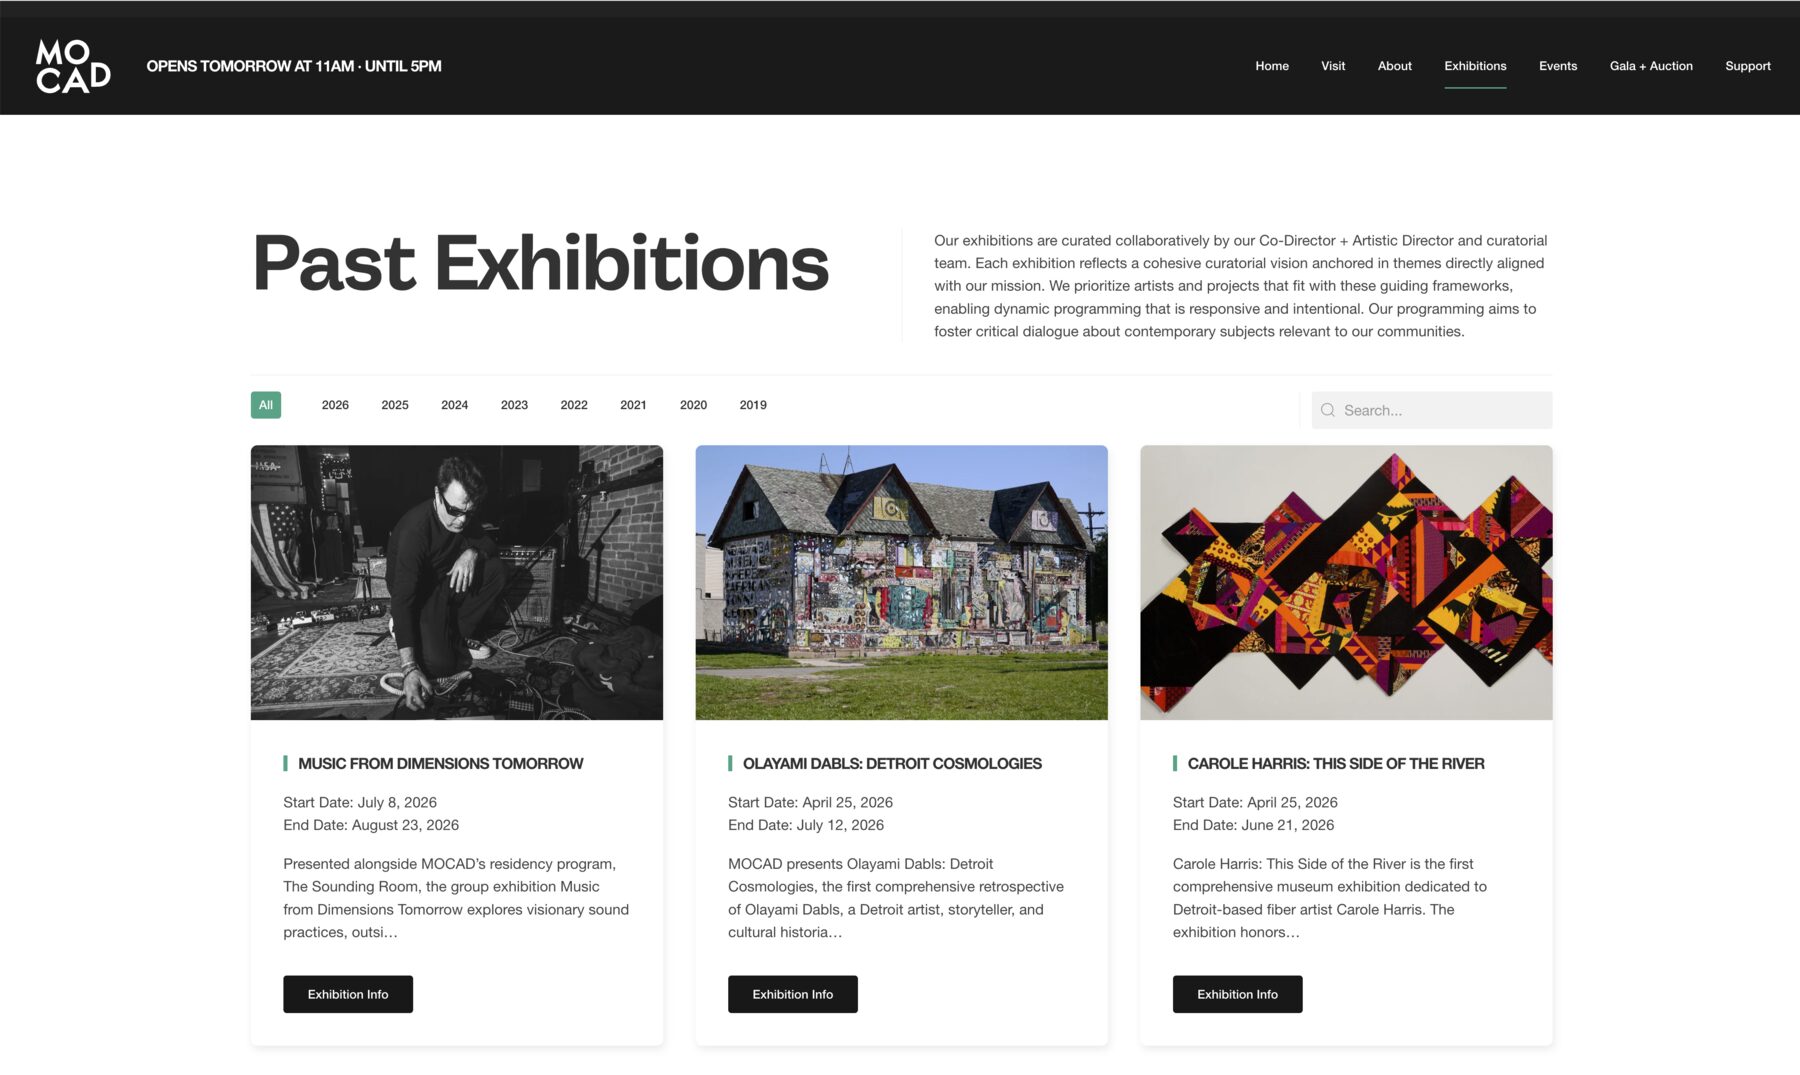
Fifty eight exhibitions rebuilt into the new structure, spanning the museum's history to date. Twenty five essays, films and recordings pulled out of exhibition pages and PDFs and published as individual editorial records. The store catalog brought onto the museum's own domain with a persistent cart and nine standardized product categories. Email, donations and membership connected. Inquiry forms for rentals and tours built with dedicated confirmation pages, so conversions could finally be measured.
Review is where large rebuilds stall, because the feedback is genuinely detailed and genuinely important. Italicize the name of the work. Spell out September rather than Sep. That credit line belongs with that biography. We ran review against a deliverable checklist and a standing feedback document, with one explicit rule: approve the template, not the hundred pages. It is the difference between a review that converges and one that does not, and on a site with several hundred pages it is the difference between finishing on a date and finishing eventually.
The museum moved off its split GoDaddy and Network Solutions setup onto consolidated managed hosting, and the content was migrated onto production infrastructure well before the launch date. That turned go live from a migration into a switch: nothing large moved on launch day, because the riskiest operation had already been done, verified, and left running quietly for days. A fixed launch date does not have to mean a high risk launch day. It means the risky work happens earlier, when there is still room to fix it.
Documentation and recorded walkthroughs, shot on the museum's own site with its own content, covering the workflows the team performs. The staging environment carried forward after launch, because the review cycle the client wanted to protect was never a development convenience. It is how their institution approves work.
Four things worth a closer look
01 · Read + Watch + Listen: a library assembled from things the museum had already made
Every exhibition MOCAD mounts generates material: a curatorial essay, a printed gallery handout, a recorded artist talk, a film. Historically all of it lived as an attachment to one exhibition page, or as a PDF, and when the exhibition closed the material closed with it. We built an editorial content type with format tagging for read, watch and listen, and a bidirectional link back to the exhibition or event it came from. Twenty five pieces were extracted, cleaned and published as individual records at launch.
Three things follow. The institution's intellectual output outlives its exhibition run. The searchable surface of the site grows without anyone writing new material. And the museum now has somewhere to bring content that had been scattered outside it, including a separate microsite, Daily Rush, carrying video on its own domain, whose cost, two domains splitting one institution's search authority, only becomes worth paying down once there is somewhere better for the content to live.
The workflow cost to curatorial staff is close to zero, which is the point. Nobody is being asked to produce more. They are being asked to hand over what they already made, once, in a form that keeps working.
02 · Recurring programs that are still individual events
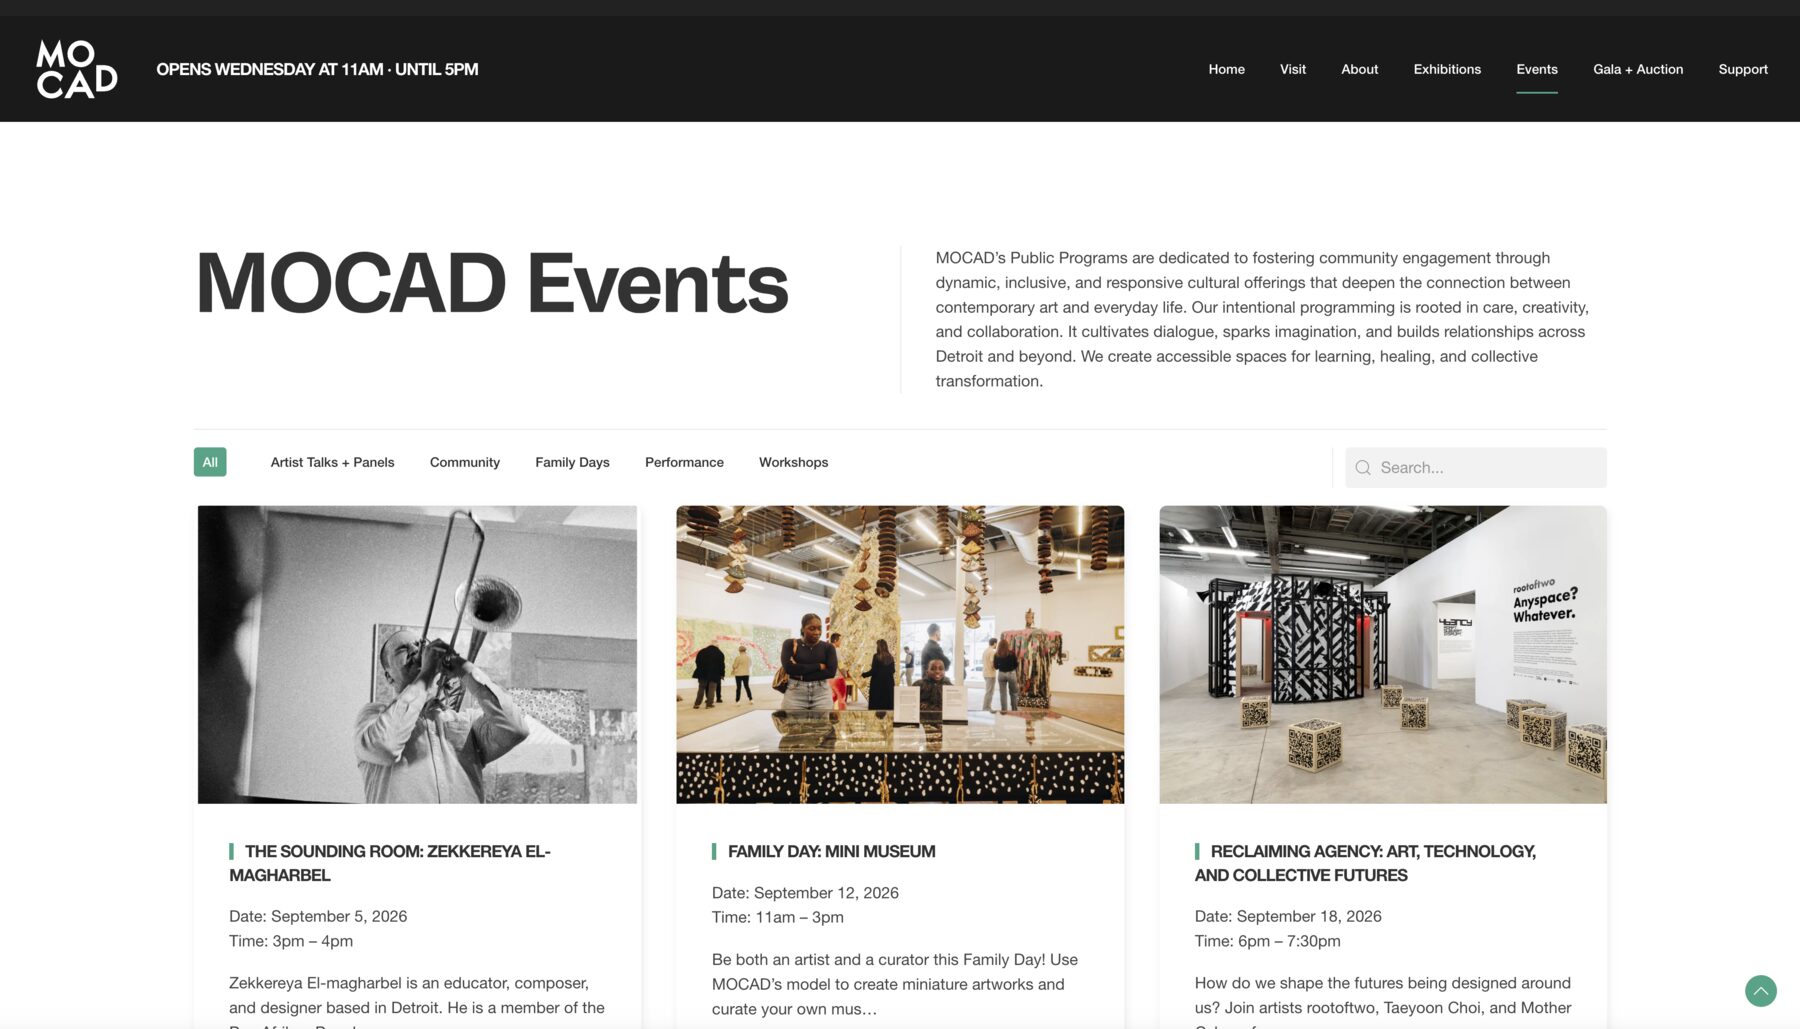
MOCAD runs series: Family Day on second Saturdays, Community Care roughly monthly, Local Spotlight on third Saturdays, curator tours through the season. The old approach stretched a single calendar entry across months, one record standing in for many, which left an individual installment hard to find, promote or archive, and its differences invisible. The new model treats each occurrence as a real event with its own date, description, image and relationship to whatever exhibition is on the walls, while the series gets a landing page that gathers its installments. Series landing pages for Local Spotlight, Community Care and Curator Tour are live today.
That structure holds up against the realities the plugin could not: a series that moves from the second Thursday to the third, a month that is canceled because a partner could not make it, a program that has run for years and now has a history worth showing.
03 · Preserving twenty years of addresses
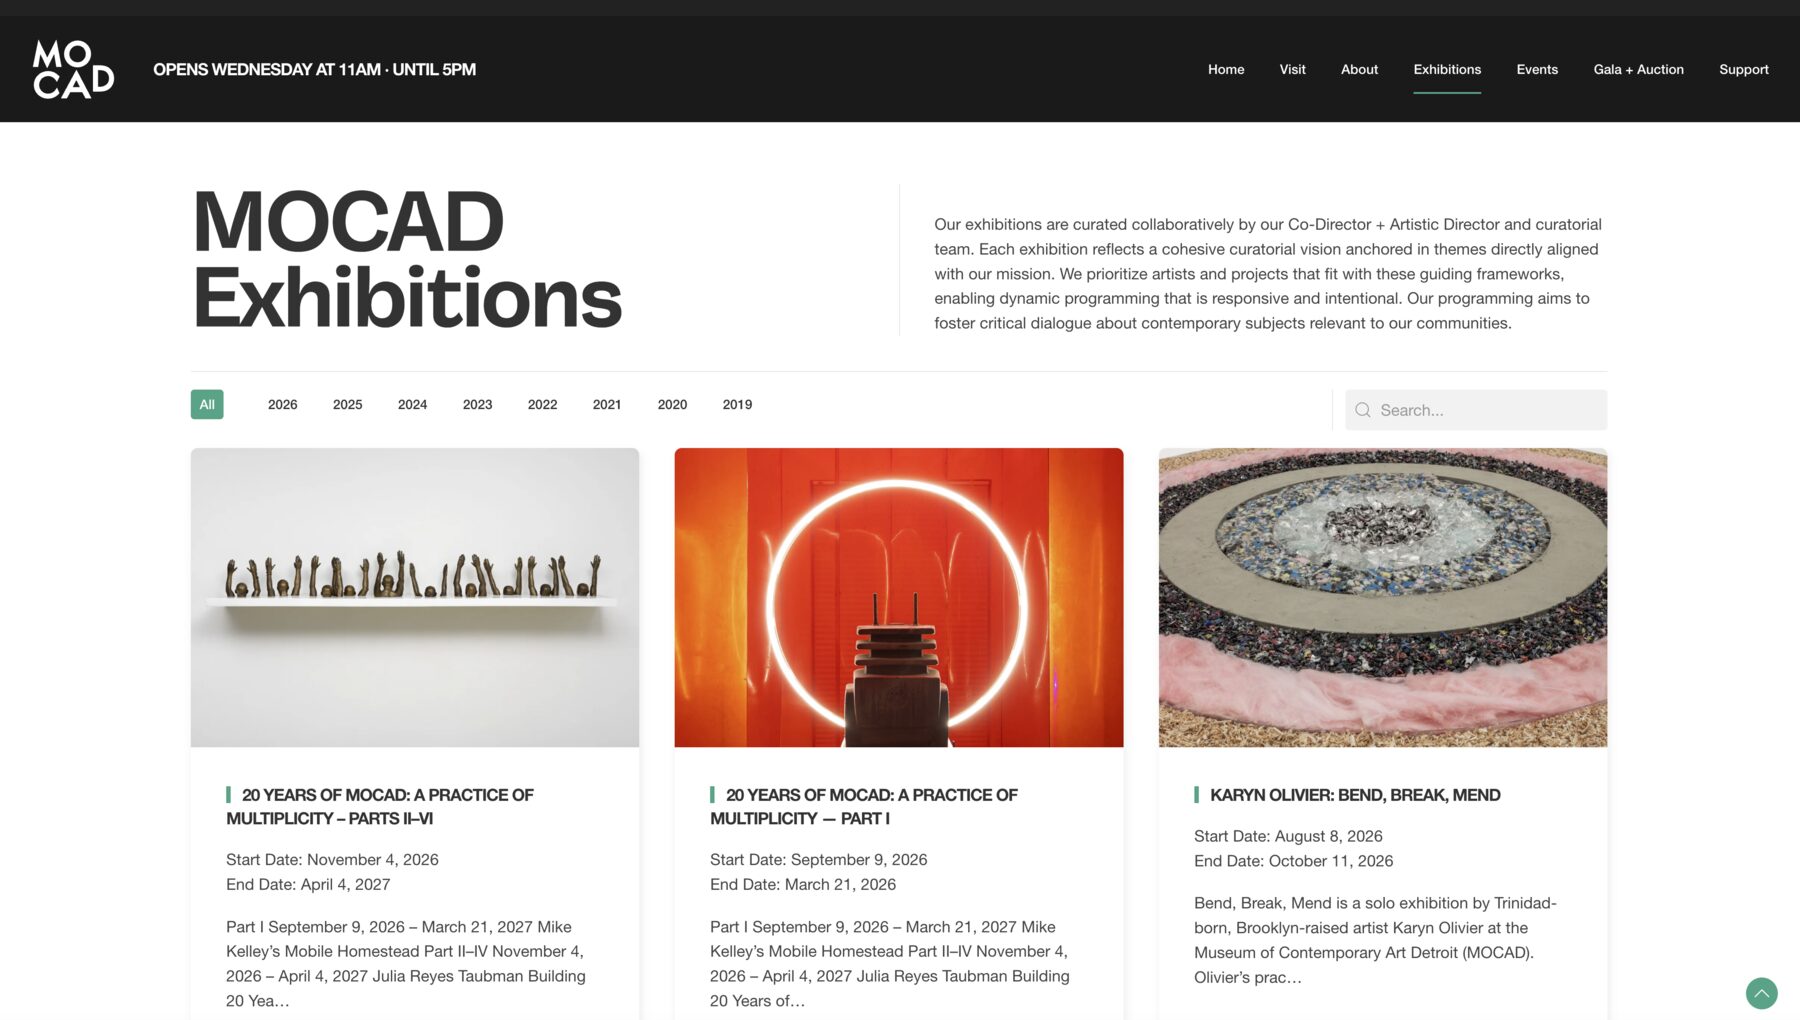
The rebuild scoped content by type, so an exhibition now lives at /exhibition/ and an editorial piece at /editorial/, which is the structure the site needed and the reason every existing link would otherwise have broken. We mapped 109 legacy addresses onto 64 destinations, every mapping decided against the actual content rather than derived from a naming pattern, because the old address space was not mechanical.
04 · One museum, one domain, one place to work
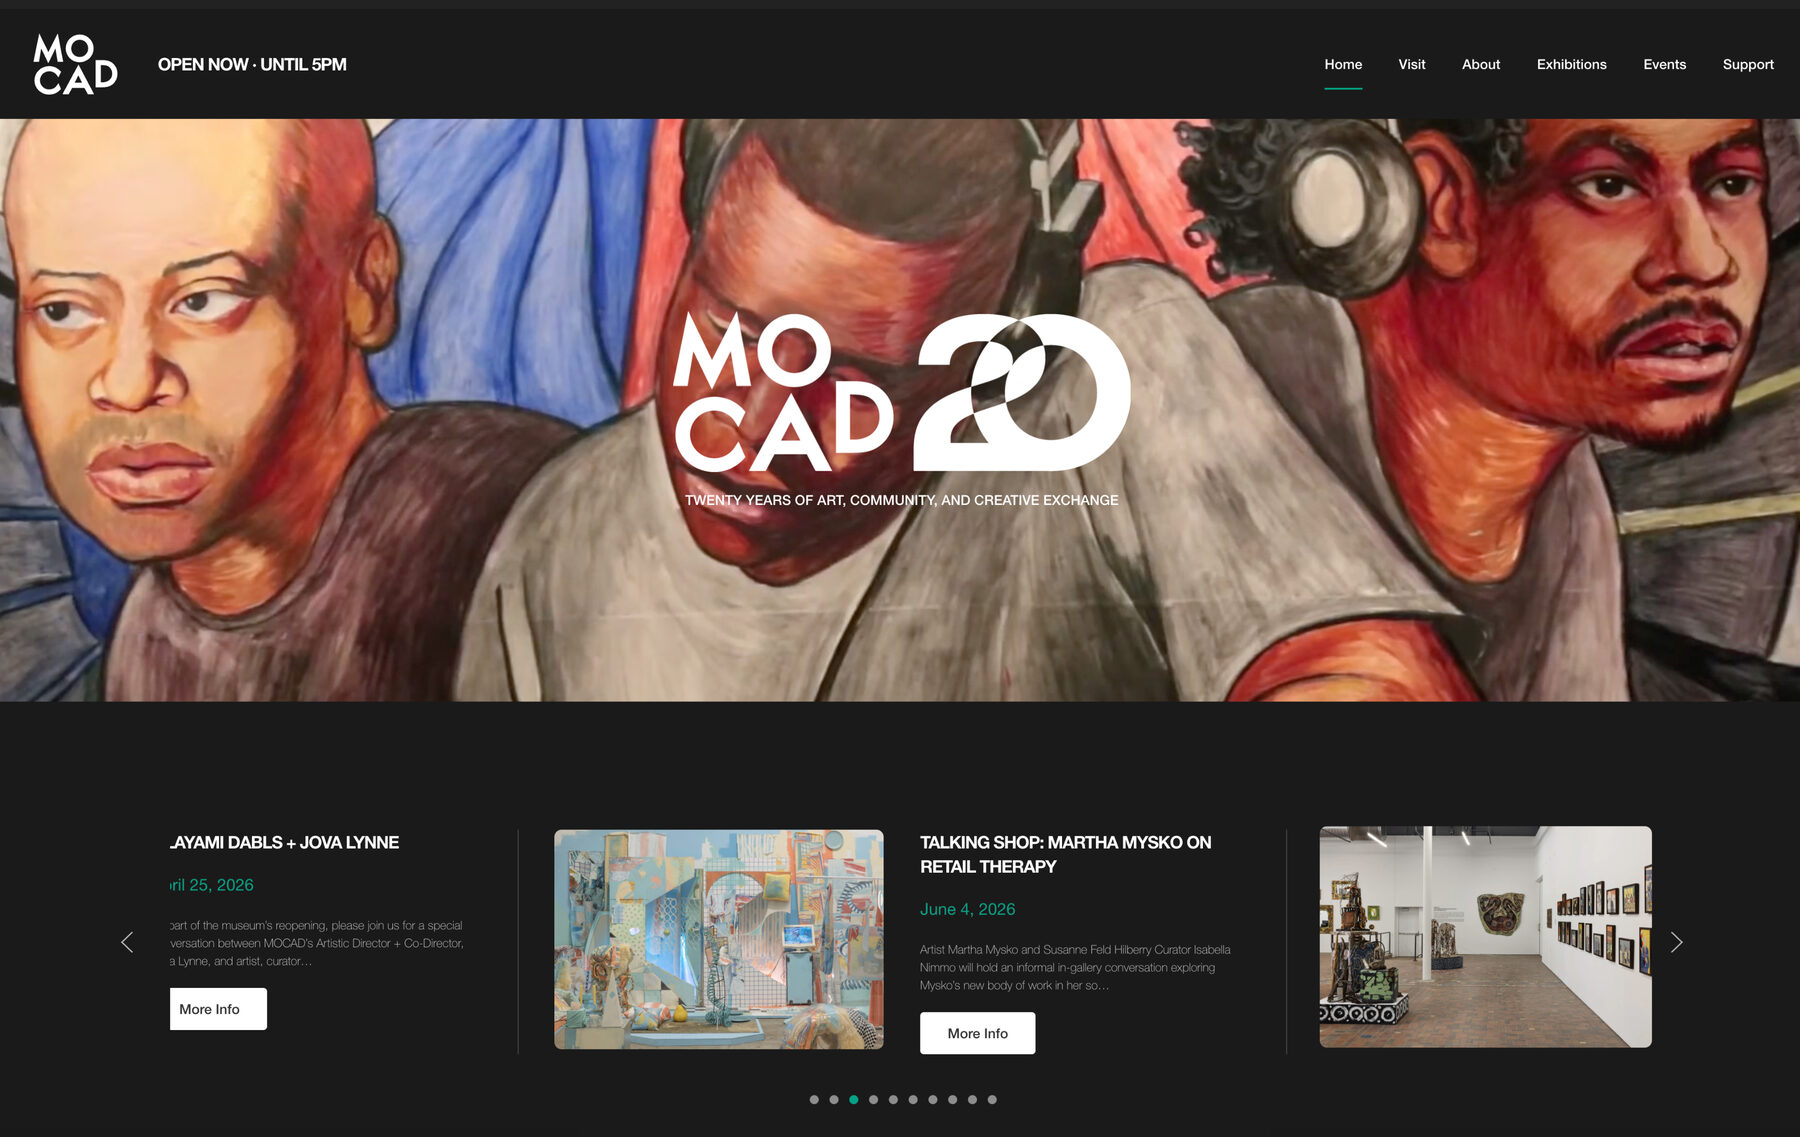
The rebuild did not try to replace the museum's five systems, because they are good systems. It brought them behind one front door. Email marketing runs from a signup on the museum's own pages. Donations and membership connect to existing tooling. Ticketing processes tickets, embedded on the museum's own event pages. The store runs commerce, with the catalog rendering on the museum's own domain and a persistent cart.
Behind the front door, one install with one set of workflows. For an institution whose entire digital presence is looked after by one Web Manager, consolidation is not a nicety. It is what makes the site maintainable at all.
What went live
The rebuilt site launched in April 2026. Delivered and verified at launch:
Built with MOCAD, not for them
Our point of contact, January to April 2026
The best thing about this project was the person we got to build it with. MOCAD’s Web Manager was our point of contact from the first call to launch day, and this rebuild carries their thinking on nearly every page of it.
They came to every conversation prepared, and the work never once waited on a decision. They read the work closely enough to catch the things that decide whether a museum’s site is correct rather than merely finished: an italic in the title of a work, a credit line sitting with the wrong biography, an artist’s name set the way the artist sets it. Reviewing several hundred pages inside a fixed schedule is only possible when someone on the institution’s side is that rigorous, and they were, page after page, for four months.
They also think in systems, which is rarer and worth more. A good deal of what shipped came from the museum rather than from us. Read + Watch + Listen was the Web Manager’s idea, brought to us with examples from peer institutions and a clear argument for why it mattered. It sat outside the signed scope. It went in because they were right, and the site is better for it.
For four months it did not feel like a client engagement. It felt like being part of the MOCAD team, working alongside people who cared about getting it right.
That is the version of this project we will remember, and we are grateful for it.
Impact: STEM In Kakuma, Kenya
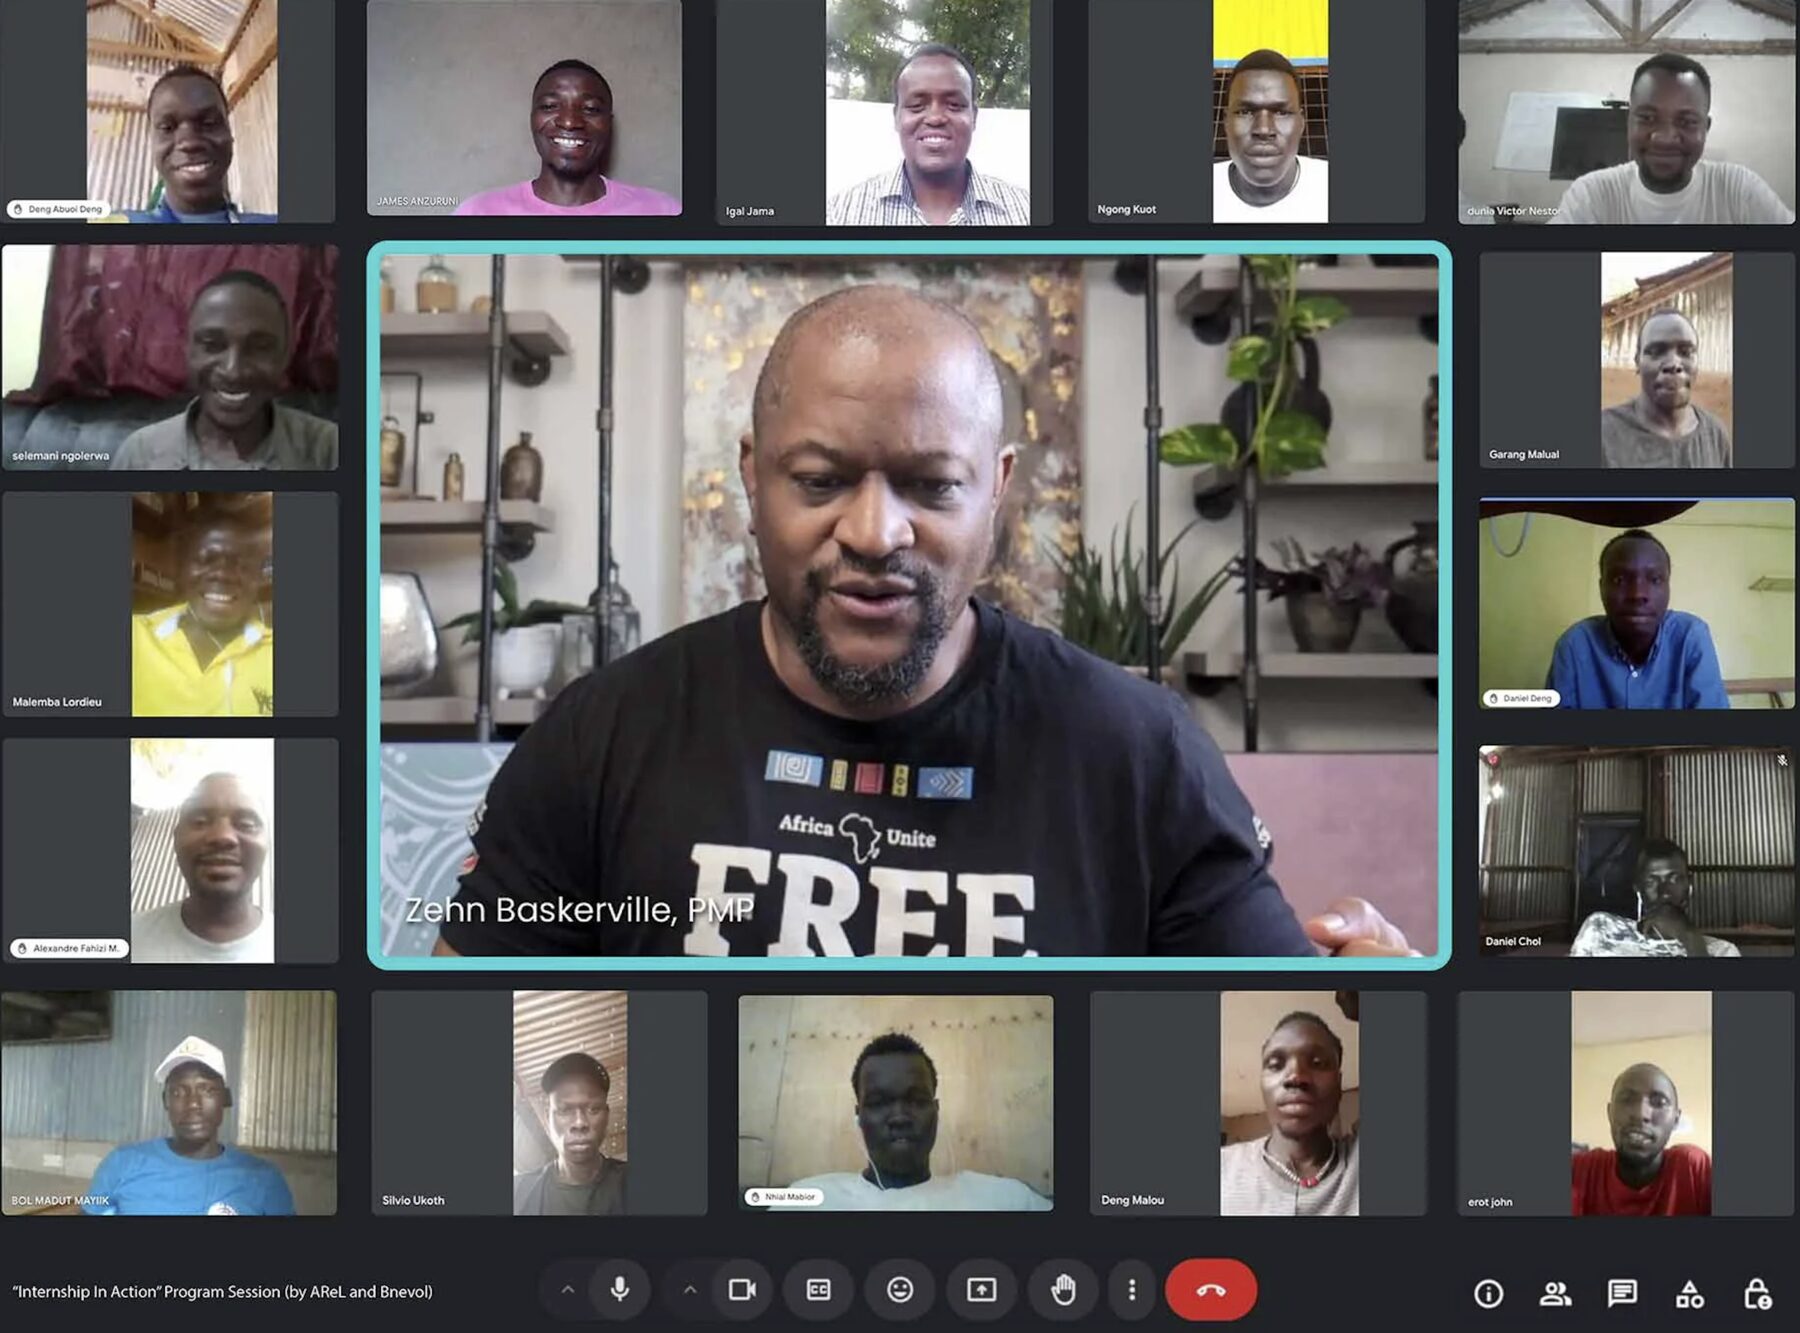
While this rebuild was underway, its architecture was being taught, session by session, to a cohort of thirty seven interns in Kakuma Refugee Camp, Kenya. Taught while it was being built: the same decisions, the same weeks, by the person building it.
The partnership
Internship In Action is a program Bnevol runs with AReL, a refugee led organization founded in Kakuma in 2022 that trains refugees in digital skills and connects them to work. Bnevol donates the technical infrastructure the program runs on: server capacity, administration accounts, individual development subdomains and sponsored software.
The program has run since 2023. What was different in 2026 is the project it was taught from.
What the program teaches: digital infrastructure
Internship In Action is a STEM program. The aim is people who can architect and engineer digital infrastructure, not only design an interface, because that is the more durable job. We tell every cohort the same thing: you are more than a web designer. You look at an organization’s challenges and you architect the solution. Then you engineer the plumbing and the mechanics underneath it, so what the client ends up with is not only a beautiful website but lasting infrastructure their organization can run on.
Neither half is optional. How the vehicle looks is not decoration. The interface is how an institution speaks to its audience: how a visitor decides to come, how a member renews, how a program fills, how a donor is moved to give. Design and user experience carry that entire conversation, and on a website that conversation is the revenue and the participation. What sits under the hood is what decides whether the conversation is still possible in five years: functionality that is reliable, seamless, and boring in the way a utility is boring, so the site becomes something the institution simply depends on. Built that way it is resilient, secure and future ready. Built the other way it needs constant attention, and it begins to decay long before anyone expected.
The two are usually taught separately. We teach both, because a site needs both to still be working in five years, and someone who can do both is rare.
MOCAD was the right project to teach from because it demanded both at once. Above the surface, the design had to hold contemporary art without competing with it, and had to make a twenty year archive feel worth exploring. Beneath it, the model had to make two decades of exhibitions, events and writing behave as one system: distinct content types, taxonomies for building and gallery, and bidirectional relationships, so a relationship entered once appears everywhere it belongs. Get both right and the infrastructure keeps carrying the institution as it changes. Get either one wrong and the other cannot save it.
That is a hard thing to teach from a textbook, because its value only becomes obvious at scale, on real content, under a deadline that cannot move. This project had all three.
So the interns followed a live build, decision by decision, and built their own version alongside it.
How it ran
Sessions ran as open class. Anyone in the cohort could stop the build and ask why a decision had been made, and other AReL students could sit in. Eleven sessions ran between March 4 and June 24, 2026, and each was recorded so interns without reliable connectivity could work from them later.
Attendance was taken every session. Two hundred and twenty three individual attendances were recorded across the eleven, and one intern was present for every single one.
Those numbers carry more weight than they appear to. Kakuma is a demanding place in which to pursue specialized technical education. Connectivity, power, working devices and quiet hours are never guaranteed, and getting to a session is rarely as simple as deciding to. AReL is what makes it possible at all. The organization operates as a technology hub for the camp, providing the connectivity and the machines its students learn on, and holding open a door to advanced STEM education that would otherwise not exist there.
Interns worked in isolated development environments of their own. Twenty one were provisioned. Task exercises mirrored the structural decisions the live build was making that week, and were carried out entirely on those environments. No intern work touched the museum's site, and the museum's delivery was never dependent on the classroom.
The museum got a rebuild delivered on a fixed date. The classroom got the rebuild's reasoning as it happened. Neither cost the other anything.

FarmLink: what they built next
Watching a build is not evidence that anyone was prepared by it. What proves preparation is what someone builds next, on their own, in a place the original never reached.
After the MOCAD build concluded, the interns built a platform of their own called FarmLink. Where MOCAD has exhibitions, events and editorial records, FarmLink has farmers, farms and crops. The subject is agriculture and it has nothing to do with a museum. The digital infrastructure underneath is the same: custom record types, every relationship bidirectional, each one mapped from a single side and resolving correctly from every other. Click a farmer and the crops assigned to them and the farms they are grown on both have to be there. Click a farm and the farmers working it appear, without anyone maintaining a list.
That is what MOCAD asked for, with every surface detail stripped away. An intern who can build FarmLink did not memorize a museum website. They understood a content model, and a content model travels. Interns built it, and then they explained it. Many filmed their finished platforms, and several have gone on to record interview style case studies of their own work, walking through what they built, why it is structured the way it is, and how the pieces connect. Explaining your own architecture back to someone else is the hardest test of whether you understood it, and it is the point where you can tell the understanding is their own.
This is the difference between training and education. An internship that ends when the client project ends has taught someone a client project. An internship that leaves an intern able to walk into an unfamiliar subject and build the right structure anyway has prepared them for the work itself. That is the part of this project that outlasts the site.
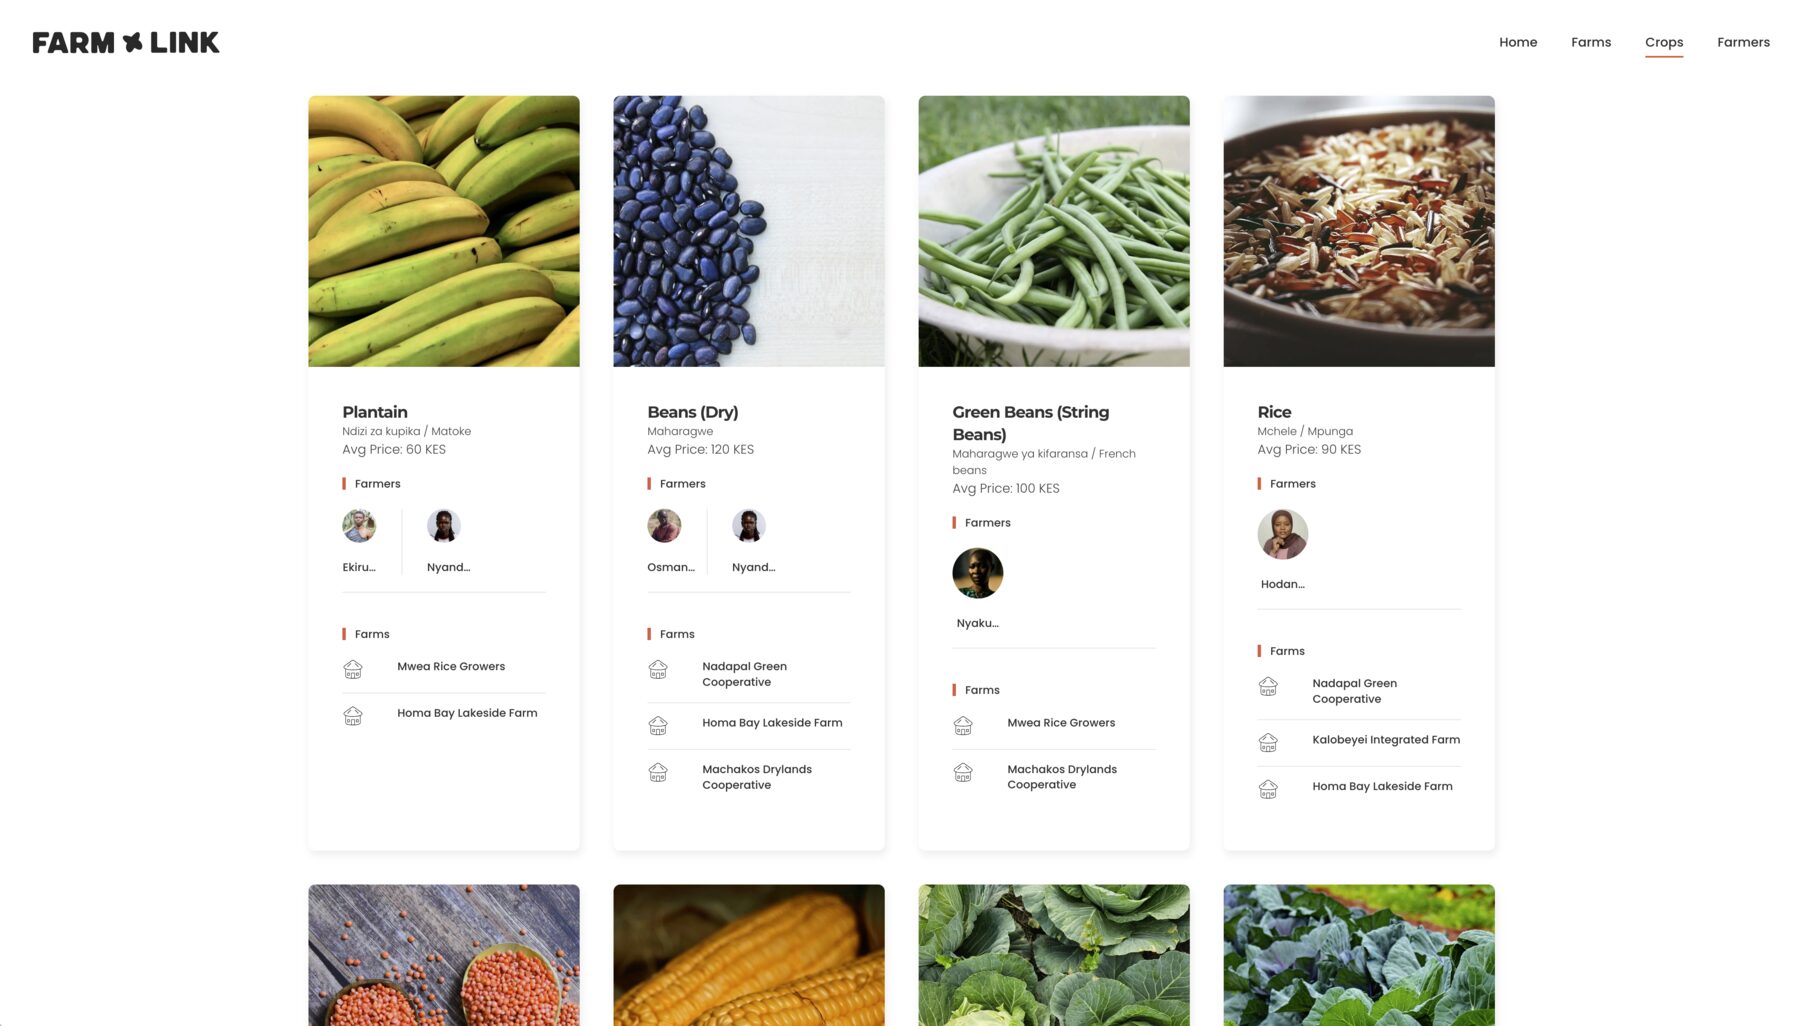
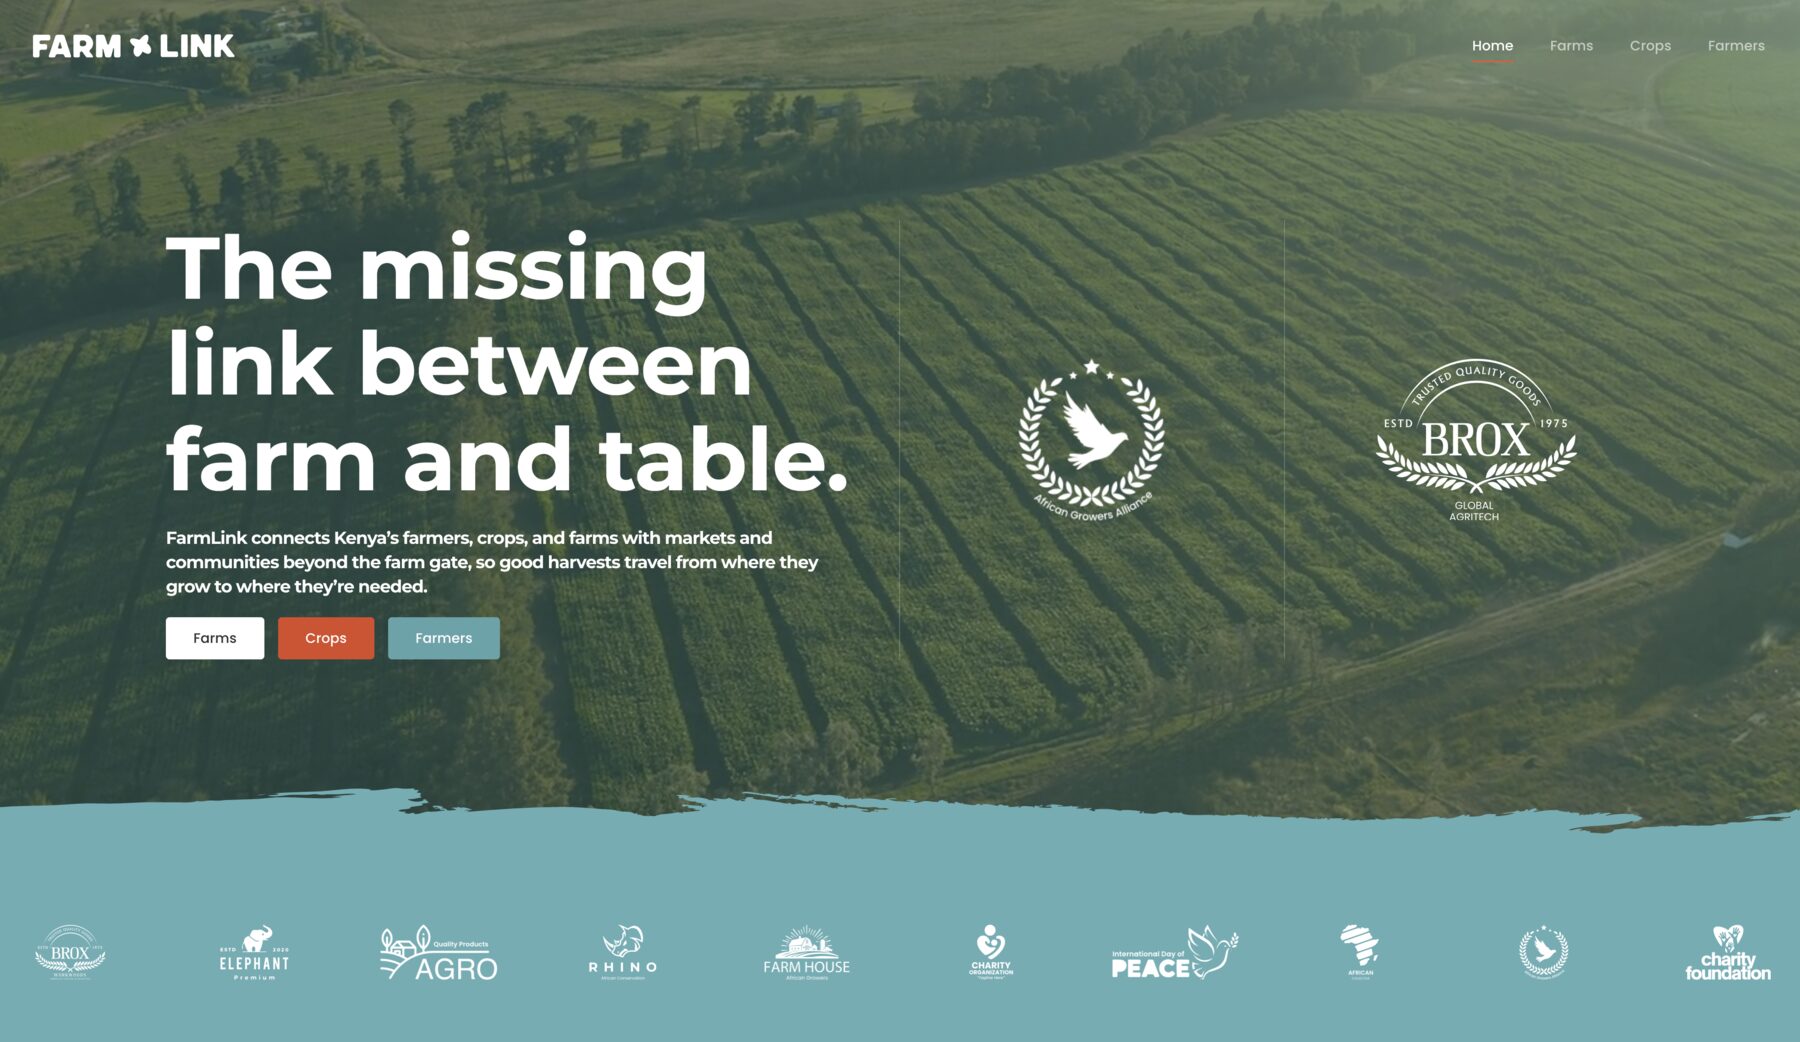
“You learn something you actually use and apply elsewhere. That is what learning should always be.”
Bnevol's founder, on why FarmLink matters
The cohort
Thirty seven interns enrolled between February 23 and May 15, 2026. They came from six countries of origin: South Sudan, the Democratic Republic of Congo, Sudan, Burundi, Ethiopia and Kenya. Ages ran from 20 to 34, with a median of 25. Nine women enrolled.
This was not a first exposure to technology for most of them. Twenty one had already completed AReL coursework before enrolling, in digital marketing, front end development, data analytics and cybersecurity. Thirty two were carrying an AReL course at the same time as the internship, in subjects including full stack development, data science and creative technology. Thirty three arrived with a LinkedIn profile already in place.
View as table
| Stage | Interns |
|---|---|
| Enrolled | 37 |
| Development environments provisioned | 21 |
| Cleared the standard and were paid | 15 |
View as table
| Country | Interns |
|---|---|
| South Sudan | 21 |
| Democratic Republic of Congo | 8 |
| Sudan | 5 |
| Burundi | 1 |
| Ethiopia | 1 |
| Kenya | 1 |
View as table
| Sessions attended | Interns |
|---|---|
| 11 of 11 | 1 |
| 10 of 11 | 5 |
| 9 of 11 | 9 |
What was paid, and for what
The program set its bar before it began: 80 percent attendance, plus a final assignment completed to standard. Fifteen interns cleared it, and each was paid a stipend of 100 US dollars.
Clearing that bar in this setting is a real accomplishment. Attending eleven sessions across sixteen weeks, in a place where none of the conditions for study can be taken for granted, took persistence well beyond what the requirement itself describes.
The stipend was not paid for showing up. Attendance was the entry condition. The payment was for delivered work, assessed against a standard nobody could negotiate after the fact.
Each of the fifteen was paid a stipend of one hundred US dollars, roughly 12,900 Kenyan shillings at September 2026 rates. It was paid as earnings for assessed work, not as aid.
What persists
The development environments remain with the interns as portfolio, on addresses they control and can show to an employer. AReL completed LinkedIn's verification process in 2026 and is now recognized as a university page, which means the program can appear in the education section of a graduate's profile alongside any other institution they attended.
Several interns from this cohort are returning as paid leads on the next Internship In Action project, a rebuild of a large United States history reference site, running small teams rather than sitting in a classroom.
The curriculum has a second life as well. The content model reasoning, the session recordings and the FarmLink build brief are all reusable, which means the teaching value of this rebuild does not end when this cohort does.
A museum needed twenty years of its own history made legible. Thirty seven interns in Kakuma, Kenya, wanted to build systems like it. The same work served both.